Your dashboard is interactive - you can get new insights with one click
If you want to look more deeply into the ways in which your media coverage has developed over time, you will be able to have these developments presented to you through various parameters. You will be able to decide for yourself whether you want to see how your media coverage has developed based on number of mentions (clippings), potential readers (impressions) or estimated value (Hypefactors Value).
How to switch between analyses with one click:
- Choose which dashboard you want to see (choose Dashboard and Measure)
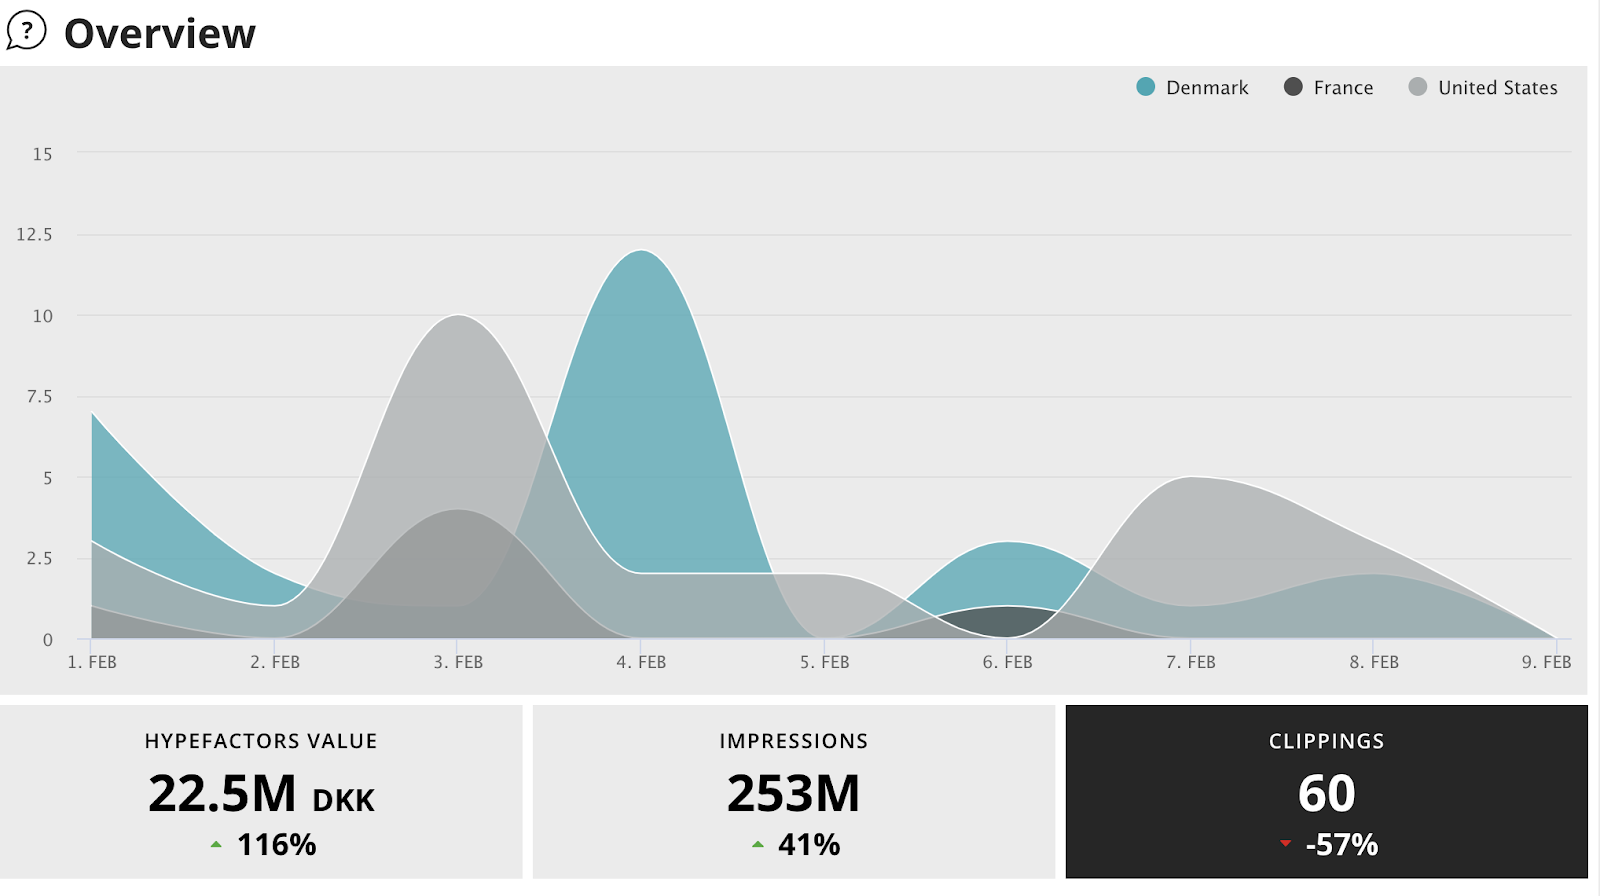
- Overview is a graph illustrating the development of your media coverage over time. Right under this graph, you will see three different key numbers (Clippings, Impressions, Hypefactors Value) that you can click on. The image below depicts developments based on the amount of clippings, which is why the clippings-number is marked with a black background.
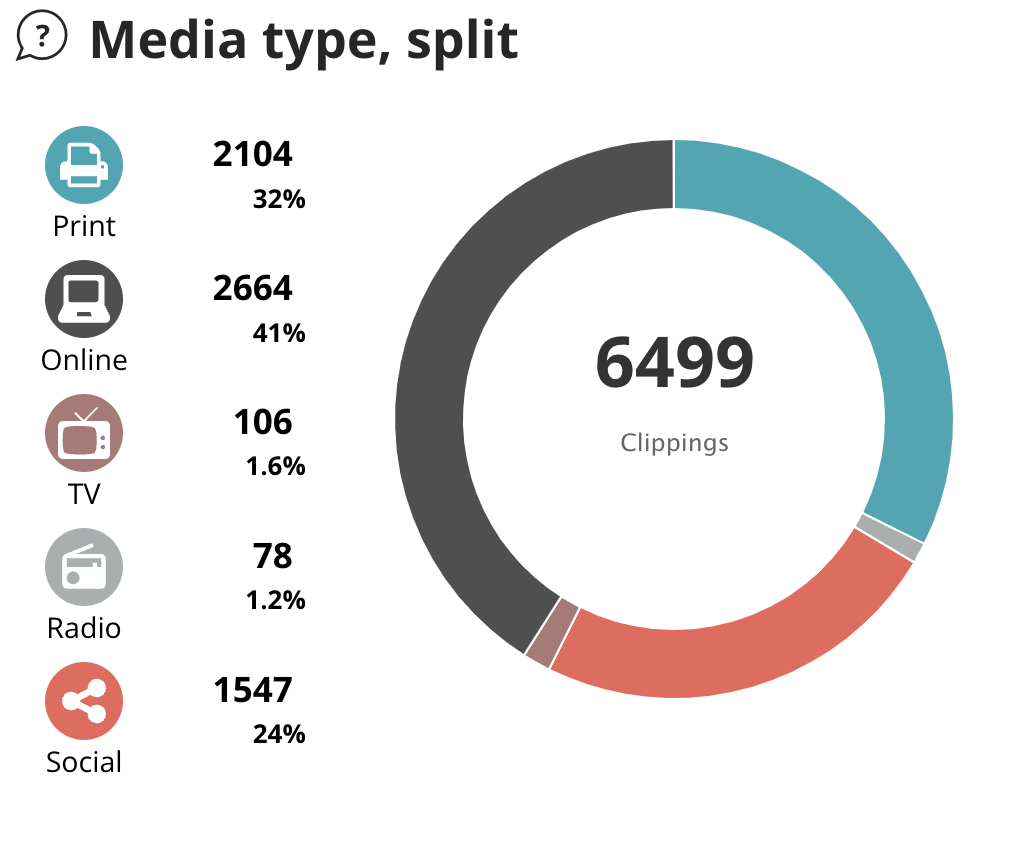
TIP: In Measure, you can see multiple analyses that change with one click. You can, among other things, see how your media mentions are distributed between various media types. It also shows which parameters the analysis is based on. The image below depicts an example of an analysis of media types based on clippings.